How Do Reopening Metrics Measure Up? Comparing the Proposed Reopening Metrics from the COVID Act Now and the COVID-Local Initiatives
Jun 18, 2020

Matt Boyce
The rapid and global spread of the SARS-CoV-2 virus, which causes COVID-19, galvanized the creation of multidisciplinary teams and initiatives around the world that sought to support response efforts. Now, as decision-makers grapple with difficult and impactful decisions regarding when and how to reopen, these initiatives are evolving to help with these decisions. Two such initiatives are COVID Act Now (CAN) and COVID-Local.
These initiatives are similar in that both seek to be additive to the COVID-19 response ecosystem and aspire to enable decision-makers to make informed decisions based on the best available data. However, they have slightly different uses. CAN provides disease intelligence and data analysis on COVID-19 in the United States of America, whereas COVID-Local strives to provide operational tools and decision frameworks for local-level authorities. Put more simply, CAN helps authorities understand the current risk environment in which they are operating and COVID-Local helps authorities conceptualize the steps required to reduce the risk and respond to the outbreak.
To this end, the tools are highly complementary, and both have developed metrics they consider essential for relaxing public health orders and reopening safely following the imposition of restrictions necessary for flattening the curve. Broadly speaking, these metrics are related to the growth rate of COVID-19 infection, testing capacity, healthcare readiness and intensive care unit (ICU) surge capacity, and contact tracing. Additionally, COVID-Local considers protecting at-risk populations to be a key metric.
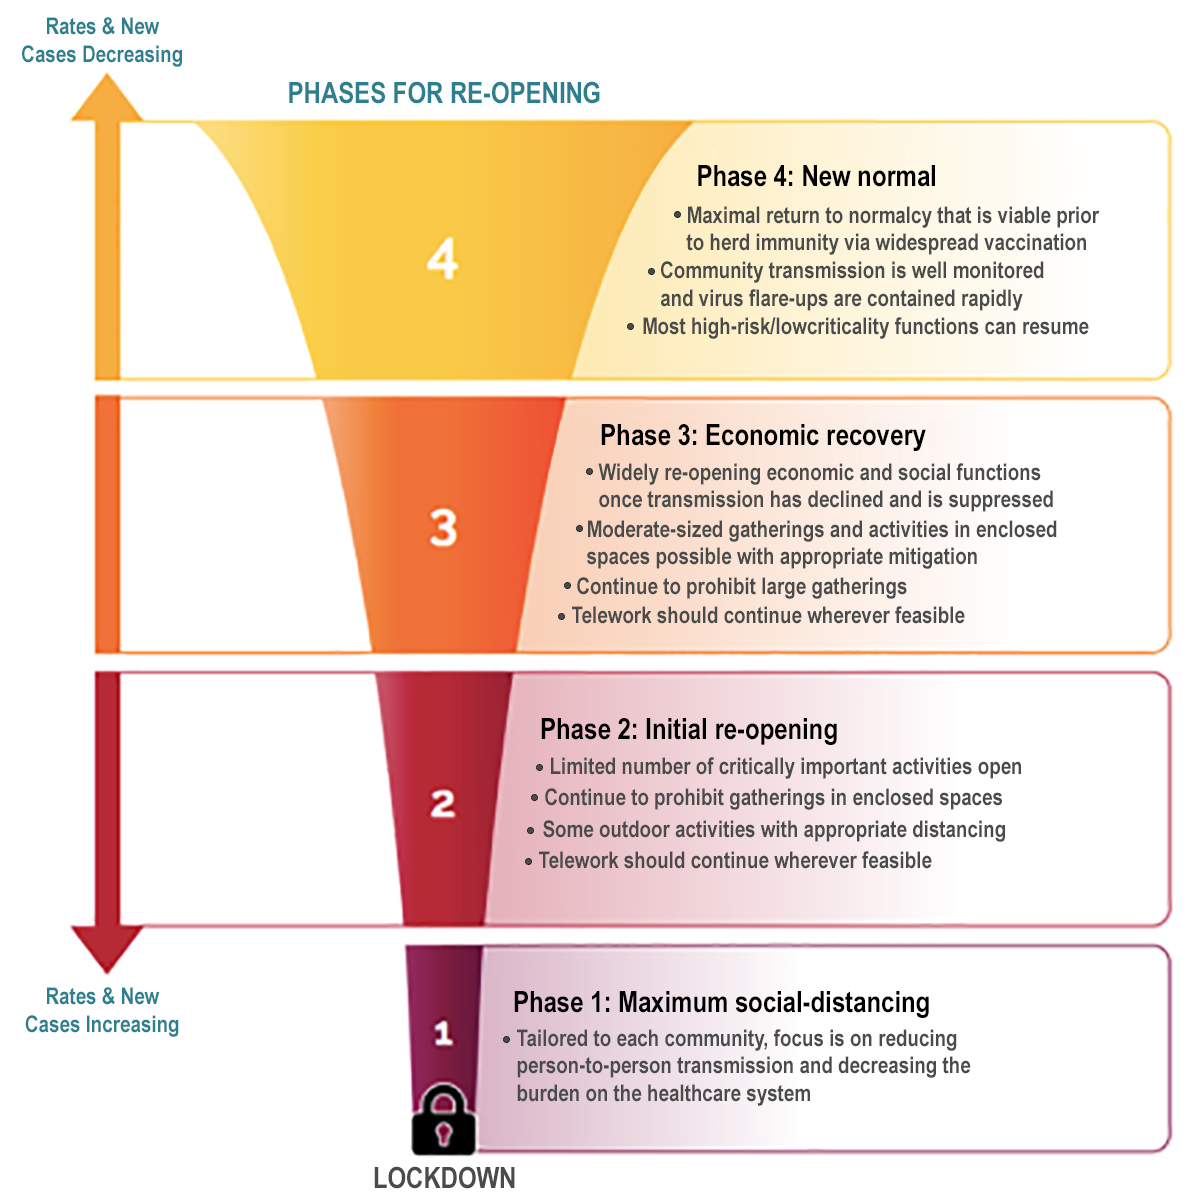
Perhaps the most substantial difference between the approaches taken by these two initiatives relates to how these metrics are assessed. CAN assesses these metrics to present a tiered warning system that characterizes the risk of reopening. Risks are categorized as critical (e.g., an active or imminent outbreak), high (e.g., at risk), medium (e.g., controlled disease growth), and low (e.g., on track to contain COVID-19). COVID-Local, on the other hand, delineates these metrics using a phased approach – similar to that being used by many governors in reopening plans – and defines specific criteria and thresholds for transitioning between four phases (Figure). While the approaches used by each initiative differ, they are similar in that both emphasize that the outbreak response is a dynamic situation that may necessitate moving up or down these respective scales.

Figure. The four phases for re-opening used by the COVID-Local team.
CAN’s reopening metric relating to COVID-19 infections considers if the number of cases is increasing, stabilizing, or decreasing (i.e., R(t) or “R-effective”). This value is calculated by considering the growth of both new positive COVID case data and COVID death data, which are sourced from the New York Times. The CAN methodology effectively creates a weighted average of R(t) values over time and draws heavily from the work of Bettencourt and Ribiero. Areas with a critical risk level have an R(t) greater than 1.4, high risk areas have an R(t) between 1.1 and 1.4, medium risk areas have an R(t) between 0.9 and 1.1, and low risk areas have an R(t) less than 0.9 (Table).
In contrast to this, the COVID-Local infection metric does not consider R(t), but focuses instead on daily case counts, test positivity rates, and cases per capita. To move from Phase 1 to 2, an area must demonstrate a sustained decline in daily cases for 21 consecutive days and this decline must continue to move to additional, less imposing phases. Areas are encouraged to transition from Phase 1 to 2 when less than 10 percent of tests conducted are positive and encouraged to transition to additional phases when less than three percent of tests conducted are positive. Finally, an area must estimate that there are fewer than five cases per 100,000 people per day to move from Phase 1 to 2, fewer than one case per 100,000 people per day to move from Phase 2 to 3, and fewer than one case per 100,000 people per week to move from Phase 3 to 4.
Table. Comparison of reopening metrics considered by COVID Act Now and COVID-Local; current as of June 18, 2020.
| Metric | COVID Act Now Thresholds | COVID-Local Thresholds | ||
| Infection Rate | Low Risk | R(t) < 0.9 | Phase 4 | NA |
| Medium Risk | 0.9 < R(t) < 1.1 | Phase 3 | NA | |
| High Risk | 1.1 < R(t) < 1.4 | Phase 2 | NA | |
| Critical Risk | R(t) > 1.4 | Phase 1 | NA | |
| Positive Test Rate | Low Risk | < 3% | Phase 4 | < 3% |
| Medium Risk | 3-10% | Phase 3 | < 3% | |
| High Risk | 10-20% | Phase 2 | 3-10% | |
| Critical Risk | > 20% | Phase 1 | > 10% | |
| ICU Headroom Used | Low Risk | < 50% | Phase 4 | < 70% |
| Medium Risk | 50-60% | Phase 3 | < 70% | |
| High Risk | 60-70% | Phase 2 | 70-85% | |
| Critical Risk | > 70% | Phase 1 | > 85% | |
| Contacts Traced | Low Risk | > 90% | Phase 4 | > 95% |
| Medium Risk | 20-90% | Phase 3 | 90-95% | |
| High Risk | 80-93% | Phase 2 | 75-90% | |
| Critical Risk | < 93% | Phase 1 | < 70% | |
While COVID-Local considers test positivity rates as a component of the COVID-19 infection metric, CAN includes it as the primary measure of their testing capacity metric. Areas with a critical risk level are characterized by having test positivity rates greater than 20 percent, areas with high risk levels have a test positivity rate between 10 and 20 percent, medium risk areas have rates between three and 10 percent, and low risk areas have a test positivity rate of less than three percent.
The COVID-Local testing metric, on the other hand, is informed by the availability of diagnostic testing, the timeliness of results, and the number of tests conducted per day. To transition from Phase 1 to 2, all symptomatic and asymptomatic high-risk individuals or contacts must have access to testing, tests must be readily available for all essential personnel, a majority of test results must be returned within 48 hours, and there should be an increasing number of tests per day. To transition from Phase 2 to 3, the first two criteria must be met, but a majority of test results must be returned within 24 hours, and the number of tests per day should be increasing, nearing sufficiency. To transition from Phase 3 to 4, the first three criteria from the previous transition must be met and a sufficient number of tests per day must be conducted.
Both initiatives cite health system capacity and the ability of systems to handle increased loads of new COVID-19 cases without having to resort to crisis standards of care as an essential consideration for reopening. CAN uses real-time data, or estimates when actual data are not available, to calculate the availability of ICU beds and determine the readiness of hospital systems to absorb an influx of patients as a result of a COVID-19 outbreak. They recommend that a hospital system be able to double its COVID patients without overloading. Areas at critical risk use between 70 and 100 percent of their ICU headroom, areas at high risk use between 60 and 70 percent, areas at medium risk use between 50 and 60 percent, and areas at low risk use less than 50 percent.
COVID-Local considers the availability of ICU beds but only defines three thresholds. An area must have 15 percent or greater ICU headroom to transition from Phase 1 to 2, and greater than 30 percent ICU headroom to transition from Phase 2 to 3. However, the initiative also considers supplies of personal protective equipment as an informer of healthcare readiness capacity. While CAN does not consider PPE supplies in their metric, they do acknowledge the importance of PPE supplies and lists it as another factor to consider when weighing the decision to reopen. To move from Phase 1 to 2, COVID-Local recommends that an area should have sufficient PPE for majority healthcare facilities, at-risk facilities, and essential personnel. To move from Phase 2 to 3, an area should have both sufficient PPE supplies and enough PPE reserves to last 14-28 days. Finally, to transition from Phase 3 to 4, areas should have sufficient PPE supplies and enough reserves to last 90 days.
The White House Coronavirus Task Force’s Guidelines identify contact tracing as a core responsibility of states to prepare for reopening, and both CAN and COVID-Local include contact tracing as a key reopening metric. CAN’s recommendations are based on the assumption that tracing all contacts of each new positive COVID-19 case within 48 hours will require an average of five contact tracers. Accordingly, an area’s risk level can be changed by either increasing the number of contact tracers or by decreasing the number of new COVID-19 cases. Areas at critical risk can trace fewer than seven percent of contacts within 48 hours, areas at high risk can trace between than seven and 20 percent of contacts within 48 hours, areas at medium risk can trace between 20 and 90 percent of contacts within 48 hours, and areas at low risk can trace greater than 90 percent of contacts within 48 hours.
Rather than examining the percent of contacts traced within 48 hours, COVID-Local’s contact tracing metric is informed by the percent of contacts traced within 24 hours, the number of contact tracers per capita, and the percent of new cases identified from contacts. It is recommended that all areas have at least 30 contact tracers per 100,000 population. In addition to this requirement, to transition from Phase 1 to 2, 75 percent of contacts should be identified and tested within 24 hours, and 60 percent of new cases should be identified contacts. To transition from Phase 2 to 3, it is recommended that at least 90 percent of contacts be identified and tested within 24 hours, and that 80 percent of new cases be identified contacts. Finally, transitioning from Phase 3 to 4, requires that 95 percent or greater of contacts be identified and tested within 24 hours, and at least 90 percent of new cases be identified contacts.
As mentioned earlier, COVID-Local also considers protecting at-risk populations as a key metric for reopening. It is recommended that to transition from Phase 1 to 2, long-term care facilities have sufficient testing, quarantine, and isolation capabilities, that the fewer than 20 percent of reported COVID-19 cases in the last 28 days come from long-term care facilities, and that local rapid response teams are available to respond to outbreak hotspots within 24 hours. To transition to other phases, the percent of cases reported from long-term care facilities in the last 28 days must decrease. Finally, it is recommended that fewer than 10 percent of reported COVID-19 cases in the last 28 days come from long-term care facilities to transition from Phase 2 to 3, and fewer than 5 percent to transition from Phase 3 to 4.
Ultimately, the recommended metrics for reopening proposed by each CAN and COVID-Local are well aligned conceptually, but with nuanced differences for measuring these metrics. In a dynamic situation with a rapidly evolving evidence-base, these types of differences are inevitable; And while these differences render the tools considered herein distinct, together they represent a valuable resource for authorities as they grapple with important decisions regarding when and how to reopen society.
This blog post is based on CGHSS Research Brief 2020-04, available at: https://ghss.georgetown.edu/covid19/.


